Hystrix Dashboard
断路器的打开和关闭状态的变化是由系统收集一些重要参数,当达到条件时才触发的。而这些请求情况的指标信息都是Hystrix Command和Hystrix Observable Command实例在执行过程中记录的重要信息,为了帮助我们系统运维或性能优化做出判断,Hystrix Dashboard实现Hystrix指标数据的可视化。
接口实现使用了@HystrixCommand注解后,这个接口的调用情况会被Hystrix记录下来,并用来给断路器和Hystrix Dashboard使用。
Hystrix-dashboard是一款针对Hystrix进行实时监控的工具,通过Hystrix Dashboard我们可以在直观地看到各Hystrix Command的请求响应时间, 请求成功率等数据。
体验一下
- 创建一个标准的Spring Boot工程,命名为:hystrix-dashboard。
- pom.xml添加依赖:
<dependencies>
    <dependency>
        <groupId>org.springframework.cloud</groupId>
        <artifactId>spring-cloud-starter-hystrix</artifactId>
    </dependency>
    <dependency>
        <groupId>org.springframework.cloud</groupId>
        <artifactId>spring-cloud-starter-hystrix-dashboard</artifactId>
    </dependency>
    <dependency>
        <groupId>org.springframework.boot</groupId>
        <artifactId>spring-boot-starter-actuator</artifactId>
    </dependency>
</dependencies>

<dependencyManagement>
    <dependencies>
        <dependency>
            <groupId>org.springframework.cloud</groupId>
            <artifactId>spring-cloud-dependencies</artifactId>
            <version>Dalston.SR1</version>
            <type>pom</type>
            <scope>import</scope>
        </dependency>
    </dependencies>
</dependencyManagement>
- 为主类加上@EnableHystrixDashboard,启用Hystrix Dashboard功能。
@EnableHystrixDashboard
@SpringCloudApplication
@EnableCircuitBreaker
public class App {
    public static void main(String[] args) {
        SpringApplication.run(App.class, args);
    }
}
- 修改application.properties配置文件:
spring.application.name=hystrix-dashboard
server.port=9908
- 运行程序,进行访问
http://localhost:1301/hystrix
说明
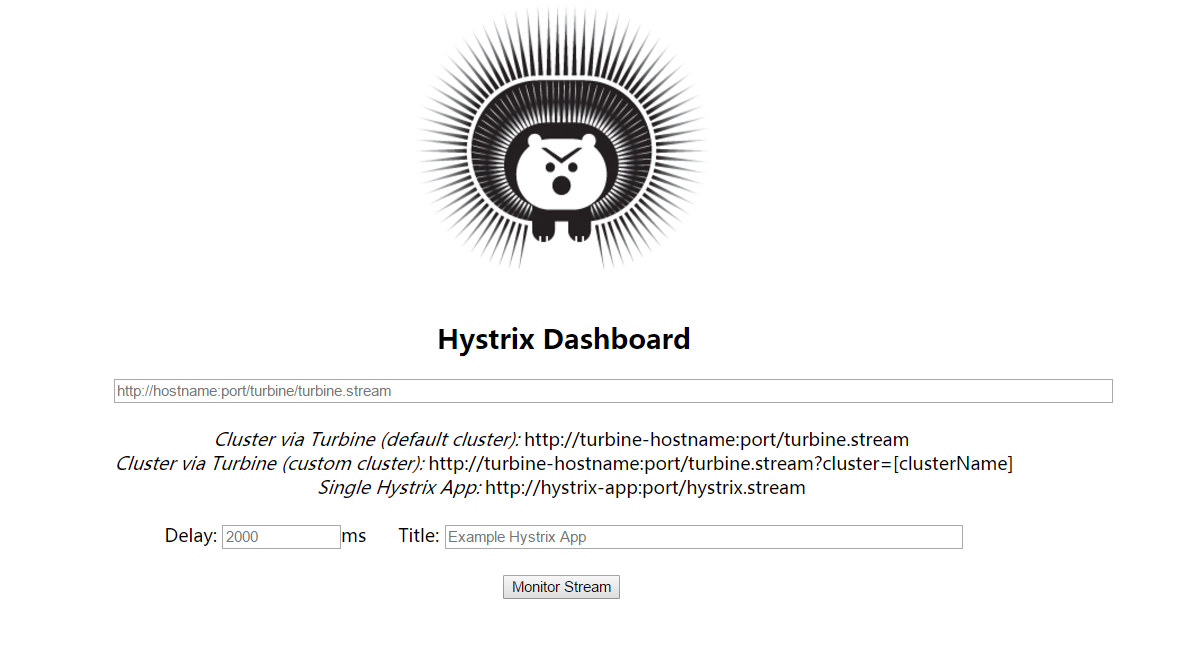
这是Hystrix Dashboard的监控首页,该页面中并没有具体的监控信息。从页面的文字内容中我们可以知道,Hystrix Dashboard共支持三种不同的监控方式,依次为:
- 默认的集群监控:通过URLhttp://turbine-hostname:port/turbine.stream开启,实现对默认集群的监控。
- 指定的集群监控:通过URLhttp://turbine-hostname:port/turbine.stream?cluster=[clusterName]开启,实现对clusterName集群的监控。
- 单体应用的监控:通过URLhttp://hystrix-app:port/hystrix.stream开启,实现对具体某个服务实例的监控。
在首页中两个参数:
- Delay:该参数用来控制服务器上轮询监控信息的延迟时间,默认为2000毫秒,我们可以通过配置该属性来降低客户端的网络和CPU消耗。
- Title:该参数对应了上图头部标题Hystrix Stream之后的内容,默认会使用具体监控实例的URL,我们可以通过配置该信息来展示更合适的标题。
- 在使用了
@HystrixCommand注解的服务实例pom.xml中的dependencies节点中新增spring-boot-starter-actuator监控模块以开启监控相关的端点,并确保已经引入断路器的依赖spring-cloud-starter-hystrix
<dependency>
    <groupId>org.springframework.cloud</groupId>
    <artifactId>spring-cloud-starter-hystrix</artifactId>
</dependency>

<dependency>
    <groupId>org.springframework.boot</groupId>
    <artifactId>spring-boot-starter-actuator</artifactId>
</dependency>
- 确保在服务实例的主类中已经使用@EnableCircuitBreaker或@EnableHystrix注解,开启了断路器功能。
- 完成了所有的配置,依次启动服务注册中心、服务提供者、服务消费者(eureka-service-consumer-hystrix)
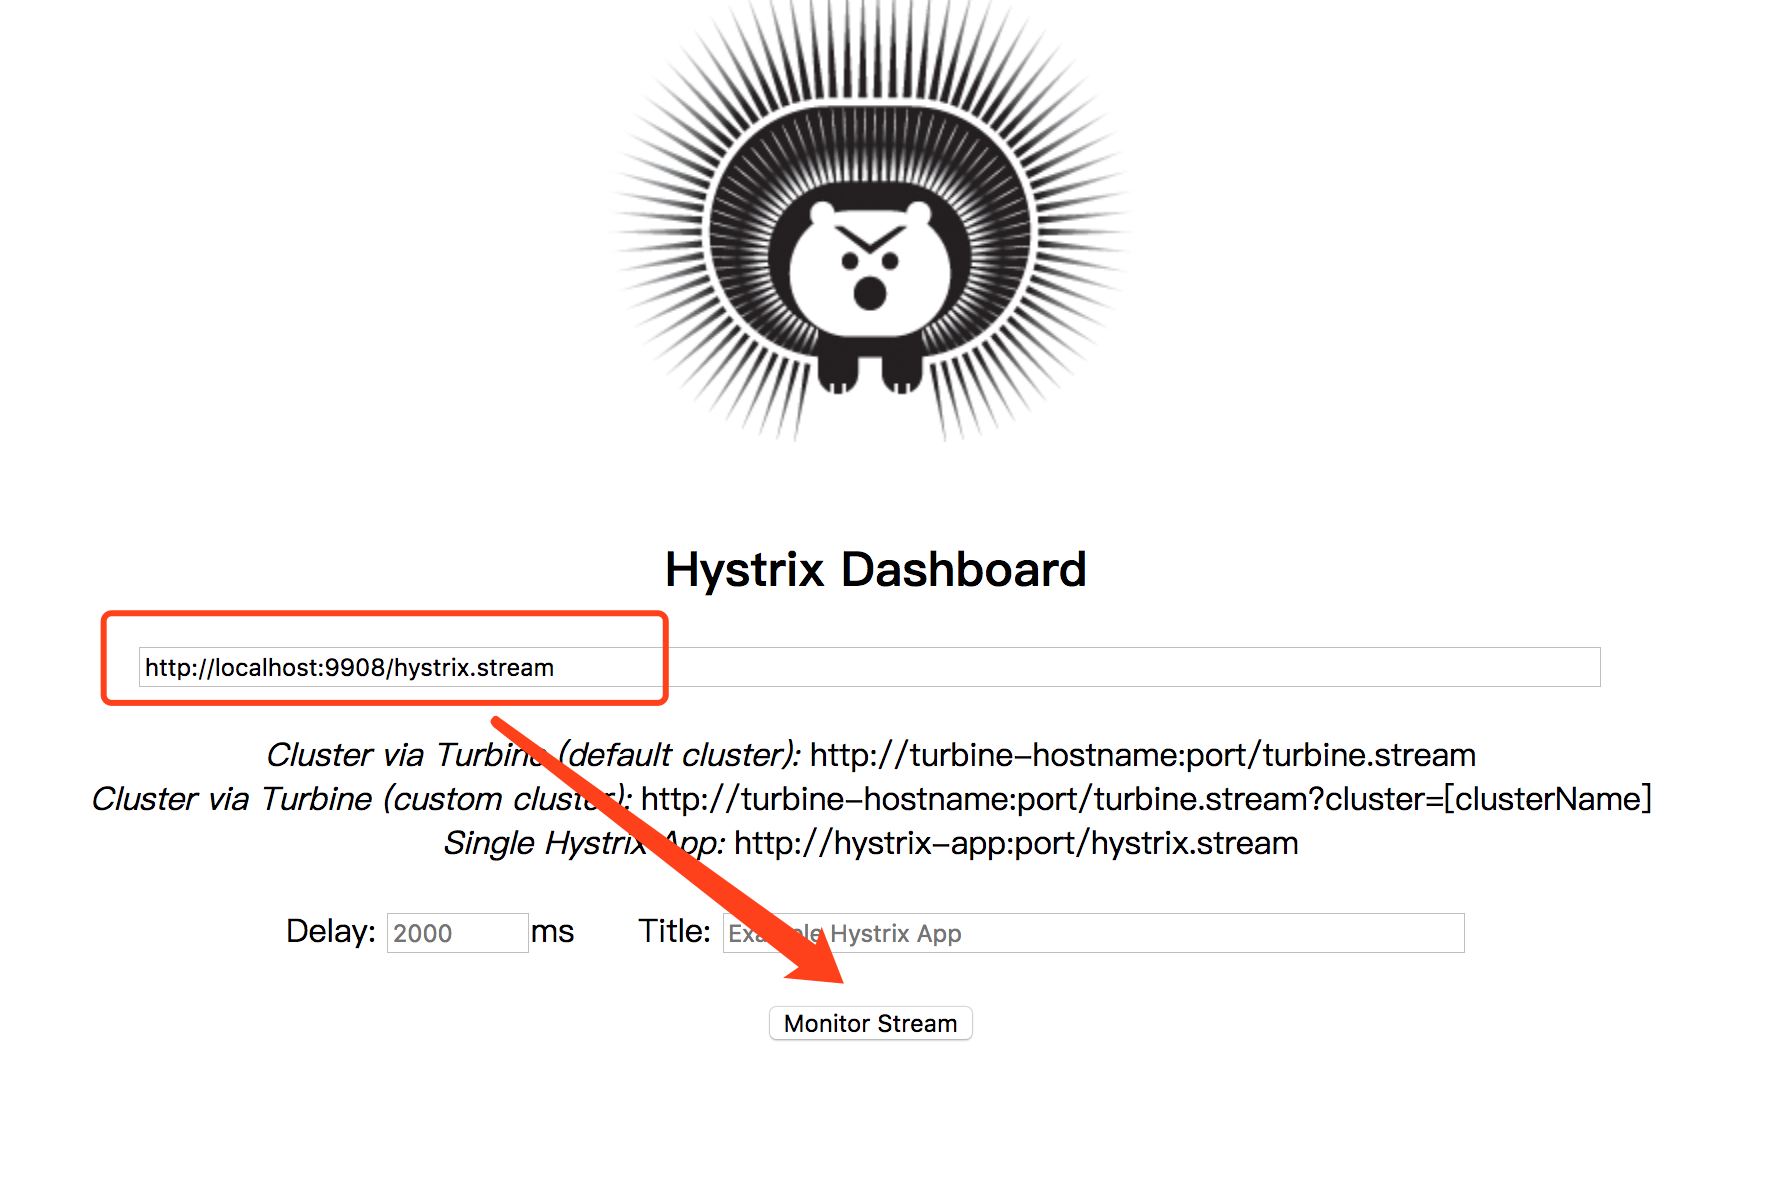
- 最后,在Hystrix Dashboard的首页输入http://localhost:9903/hystrix.stream,已启动对“eureka-service-consumer-hystrix”的监控,点击“Monitor Stream”按钮,此时我们可以看到如下页面:
入口:
效果:
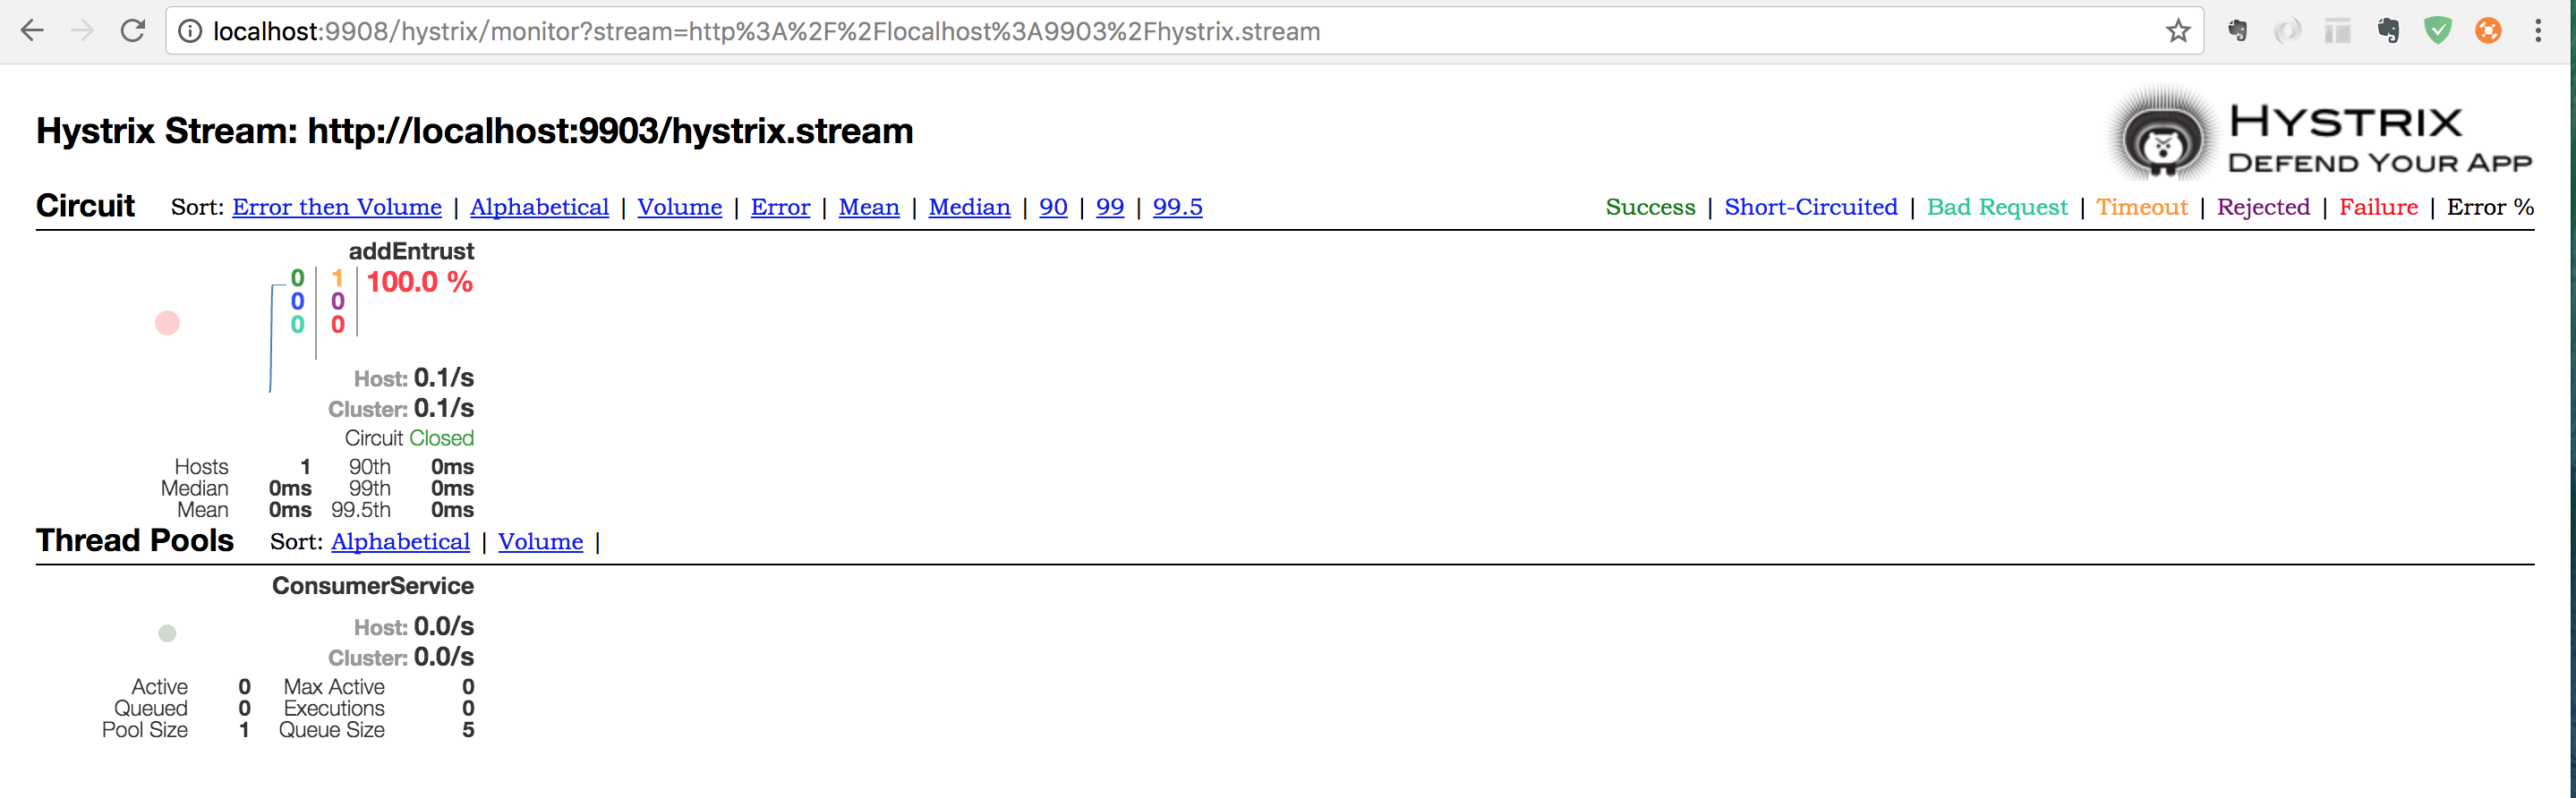
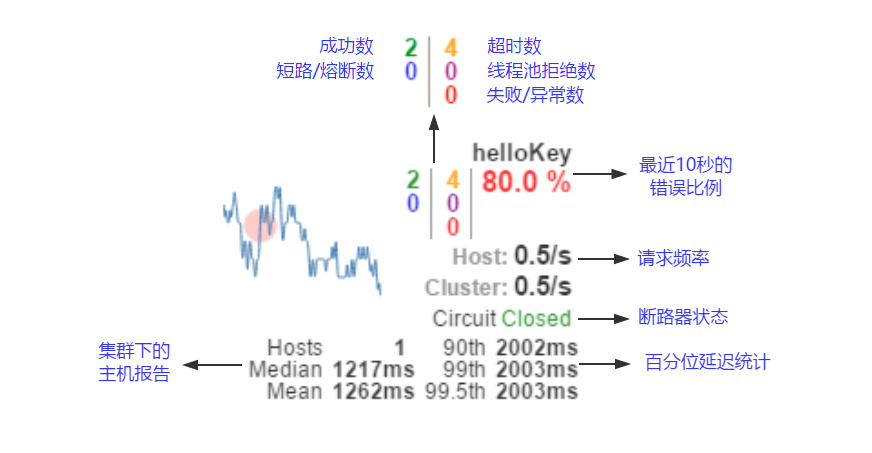
在监控信息的左上部分找到两个重要的图形信息:一个实心圆和一条曲线。
实心圆:共有两种含义。它通过颜色的变化代表了实例的健康程度,如下图所示,它的健康度从绿色、黄色、橙色、红色递减。该实心圆除了颜色的变化之外,它的大小也会根据实例的请求流量发生变化,流量越大该实心圆就越大。所以通过该实心圆的展示,我们就可以在大量的实例中快速的发现故障实例和高压力实例。
曲线:用来记录2分钟内流量的相对变化,我们可以通过它来观察到流量的上升和下降趋势。